I have been embedding Python recently in a number of C++ projects and was disappointed with the quality of the open source debuggers out there. In addition I had a requirement to embed a Python debugger into a work project so that it could be used by end-users to debug their Python Scripts. Thus was born PyDebug++. This is a collection of freeware MFC classes which implement a fully embeddable Python Debugger for Windows applications developed using Visual C++ 2017 or later and MFC.
The classes provided are: CPyDebugBreakpoint, CPyDebugBreakpointsListCtrl, CPyDebugBreakpointsWnd, CPyDebugCallStackListCtrl, CPyDebugCallStackWnd, CPyDebugChildFrame, CPyDebugDoc, CPyDebugFrameWnd, CPyDebugModule, CPyDebugModulesWnd, CPyDebugMultiDocTemplate, CPyDebugOutputWnd, CPyDebugOutputWndDoc, CPyDebugPropertiesToolBar, CPyDebugPropertiesWnd, CPyDebugStackFrame, CPyDebugThread, CPyDebugThreadsListCtrl, CPyDebugThreadsWnd, CPyDebugVariable, CPyDebugVariablesEdit, CPyDebugVariablesListCtrl, CPyDebugVariablesWnd, CPyDebugView, CPyObject & CPyGILAutoLock.
CPyDebugBreakpoint is a POD type class which represents a breakpoint as shown in the PyDebug++ Breakpoints window.
CPyDebugBreakpointsListCtrl is the CListCtrl derived class as shown in the PyDebug++ Breakpoints window. It supports deletion of breakpoints via the keyboard, custom draw code to draw the currently active breakpoint in bold, toggling the enabled state of breakpoints and breakpoint document navigation. A TO DO item for the future for this class would be to support more advanced breakpoint functionality such as hit counts as you see in the Visual Studio breakpoints window.
CPyDebugBreakpointsWnd is a CDockablePane derived class which implements the PyDebug++ Breakpoints window. It contains a CPyDebugBreakpointsListCtrl instance and is hosted by an instance of the CPyDebugFrameWnd class.
CPyDebugCallStackListCtrl is the CListCtrl derived class as used in the PyDebug++ Call Stack window. It supports stack frame document navigation.
CPyDebugCallStackWnd is a CDockablePane derived class which implements the PyDebug++ Call Stack window. It contains a CPyDebugCallStackListCtrl instance and is hosted by an instance of the CPyDebugFrameWnd class.
CPyDebugChildFrame is a CMDIChildWndEx derived class which hosts the MDI child frame for Python Doc/View instances.
CPyDebugDoc is a standard MFC CDocument derived class which is used to host the Python document. This class is derived from the CScintillaDoc class provided by the author's Scintilla wrapper classes.
CPyDebugFrameWnd is the main frame window used to orchestrate the whole PyDebug++ framework. In the sample application included in the download it is created using the usual MFC Doc/View code in the application's InitInstance call. In your application you might want to create an instance of this using CPyDebugFrameWnd::LoadFrame(IDR_PYDEBUG_MAINFRAME) at some point in your application's code. This class contains most of the orchestration code to implement the actual Python debugger. Internally it will show the IDR_PYDEBUG_MAINFRAME and IDR_PYDEBUG_PYTHON_DOCUMENT menus and the standard and debug toolbars. It also maintains all the dockable windows and the internal Python debugger state.
CPyDebugModule is a POD type class which represents a module as shown in the PyDebug++ Modules window.
CPyDebugModulesWnd is a CDockablePane derived class which implements the PyDebug++ Modules window. It contains a CListCtrl instance and is hosted by an instance of the CPyDebugFrameWnd class.
CPyDebugMultiDocTemplate is a CMultiDocTemplate used to manage the doc / template framework for PyDebug++.
CPyDebugOutputWnd is a CDockablePane derived class which implements the PyDebug++ Output window. To support search functionality in the output window, the class hosts a CScintillaView instance which allows it to reuse the standard Find dialog functionality provided in that class. This is an example of a class directly hosting a CView based class without going through the standard MFC Doc/View architecture. It also implements a custom context menu which supports "Copy", "Clear" and "Select All" functionality.
CPyDebugOutputWndDoc is a standard MFC CDocument derived class as used by the CPyDebugOutputWnd class.
CPyDebugPropertiesToolBar is a CMFCToolBar derived class which is hosted in the Properties dockable window to support "Show Properties in Groups" and "Sort Properties Alphabetically" functionality.
CPyDebugPropertiesWnd is a CDockablePane derived class which implements the PyDebug++ Properties window
CPyDebugStackFrame is a POD type class which represents a single stack frame as shown in the PyDebug++ Call Stack window.
CPyDebugThread is a POD type class which represents a single thread as shown in the PyDebug++ Threads window.
CPyDebugThreadsListCtrl is a CListCtrl derived class as shown in the PyDebug++ Threads window. It supports custom draw code to draw the currently active thread in bold.
CPyDebugThreadsWnd is a CDockablePane derived class which implements the PyDebug++ Threads window. It contains a CPyDebugThreadsListCtrl instance and is hosted by an instance of the CPyDebugFrameWnd class.
CPyDebugVariable is a POD type class which represents a variable as shown in the Watch, Globals, Built-Ins & Locals windows.
CPyDebugVariablesEdit is a CEdit derived class which is used by the CPyDebugVariablesListCtrl to allow the value of a variable to be edited by an in place edit box. An instance of this class is created at runtime by the CPyDebugVariablesListCtrl class.
CPyDebugVariablesListCtrl is a CListCtrl derived class as used in the PyDebug++ Watch, Globals, Built-Ins & Locals windows. It supports creation and deletion of variables and values via the keyboard and mouse, changing variable values via an in place edit box, and custom draw code to draw the changed variables in red.
CPyDebugVariablesWnd is a CDockablePane derived class which implements the PyDebug++ Watch, Globals, Built-Ins & Locals windows. Four instances of this class are hosted by an instance of the CPyDebugFrameWnd class.
CPyDebugView is a standard MFC CView derived class used to host the Python document. This class is derived from the CScintillaView class provided by the author's Scintilla wrapper classes.
CPyObject is a simple RAII wrapper class for the Python C-API "PyObject*" value. As all Python objects are reference counted similar to COM objects in the Win32 API, you will eventually tire of having to sprinkle Py_INCREF and Py_DECREF calls throughout your codebase. This occurred during the development of the PyDebug++ framework itself. The class is modeled on the ATL CComPtr class and makes it much easier to deal with the Python C-API. This class is implemented as a header only class in PythonPtr.h and can be used independently of the other PyDebug++ classes. Even if you do not need the PyDebug++ debugger, you might find this class helpful when using the Python C-API in your C/C++ code.
CPyGILAutoLock is a simple RAII wrapper class for acquiring and releasing the Python GIL.
The enclosed zip file contains the wrapper class source code and a simple VC2017 demo application which exercises all of the framework classes functionality.
The following are sample screen captures of the PyDebug++ framework in operation on Windows 10 from the included sample application included in the download. It should help you decide very quickly if you want to use the framework in your applications.
Figure 1: Here's a screen capture showing the demo application using the PyDebug++ class framework and the Output Window docked to the bottom of the UI:
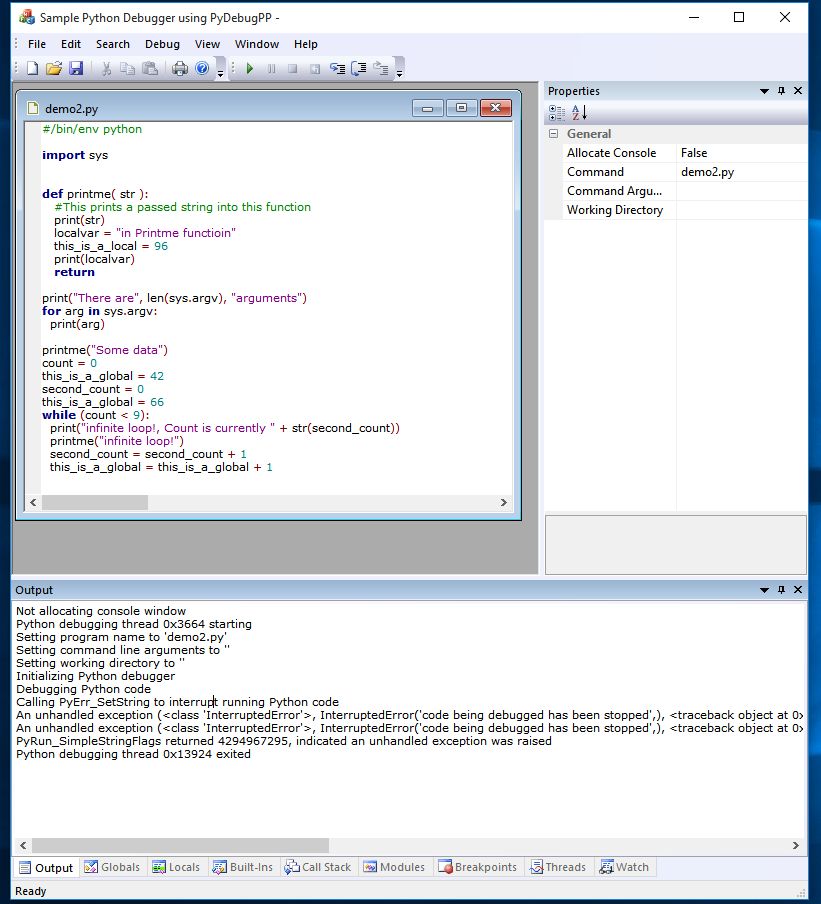
Figure 2: Here's the Debug menu shown along with the Globals Window:
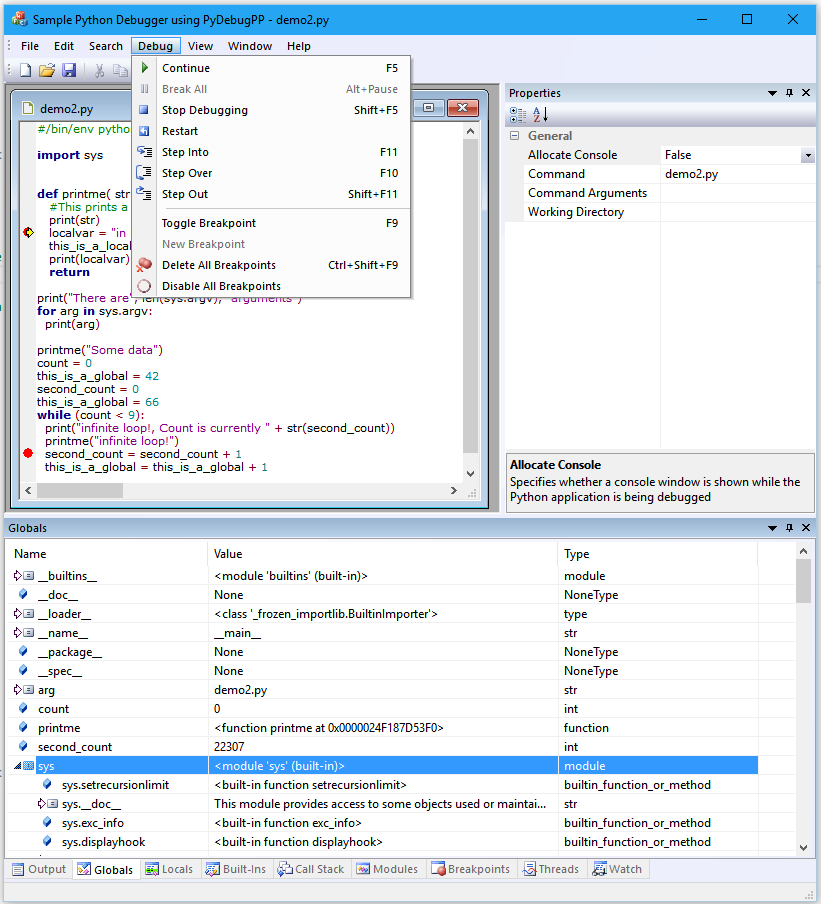
Figure 3: Here's the Locals Window:
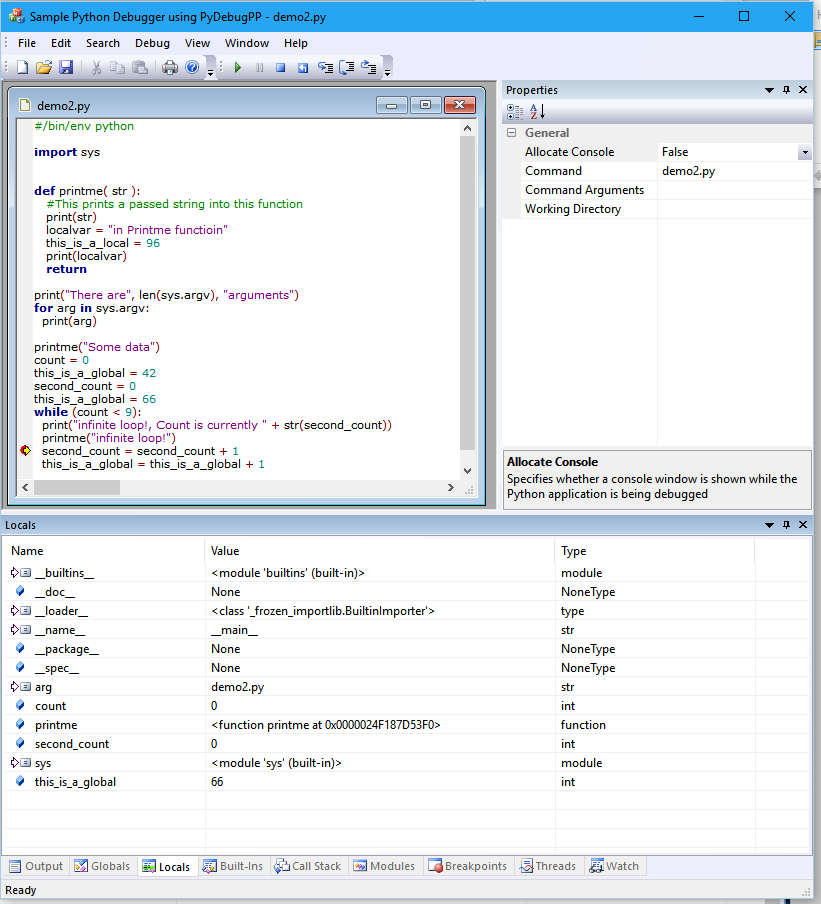
Figure 4: Here's the console of a debugged script active and the Built-Ins Window:
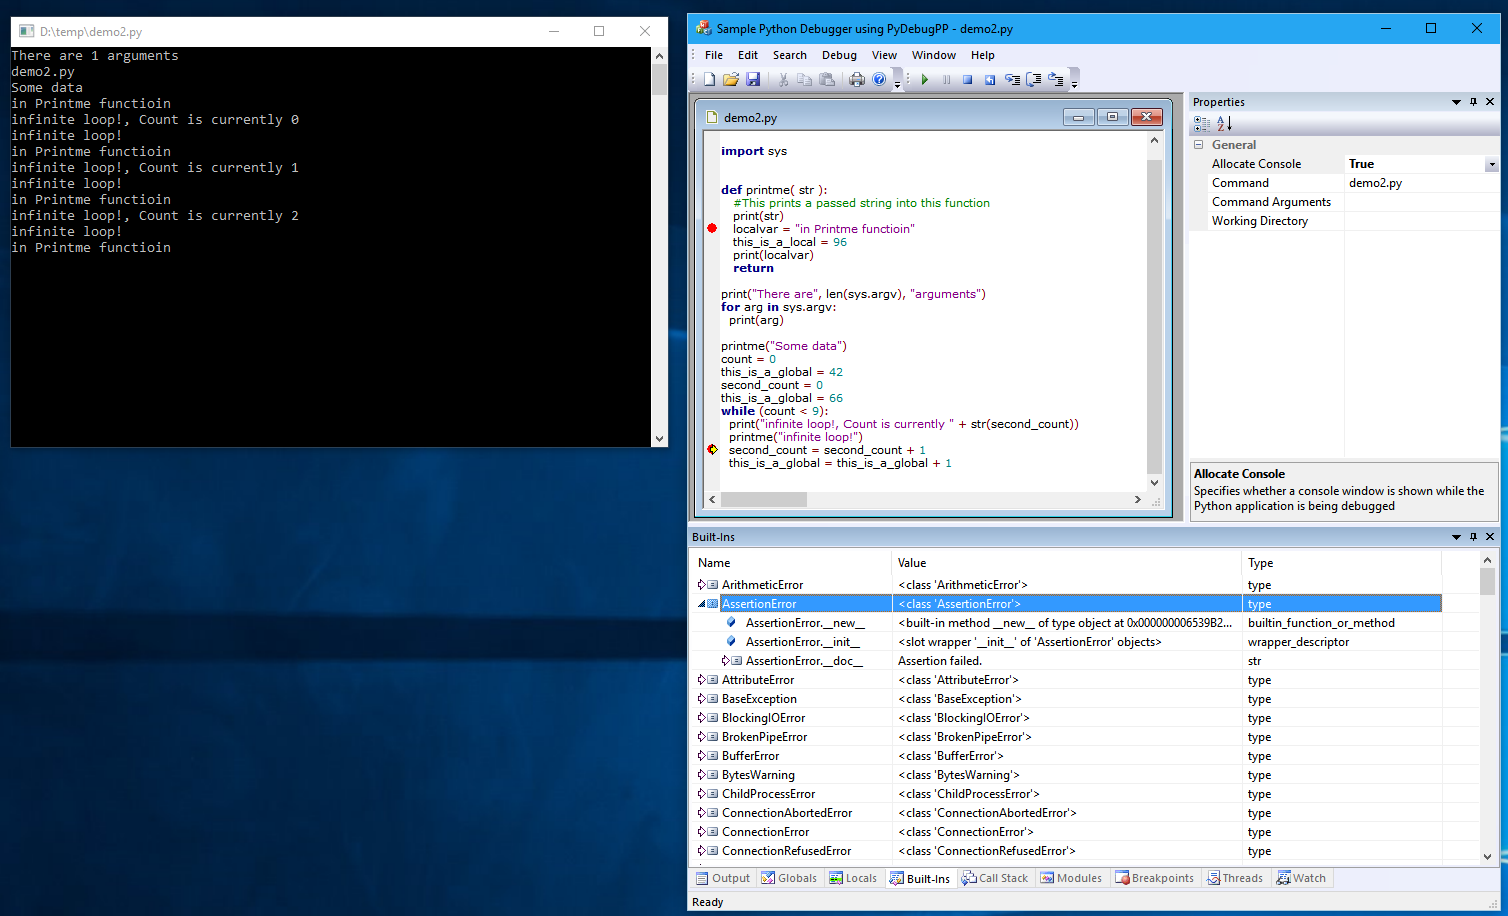
Figure 5: Here's the Call Stack Window:
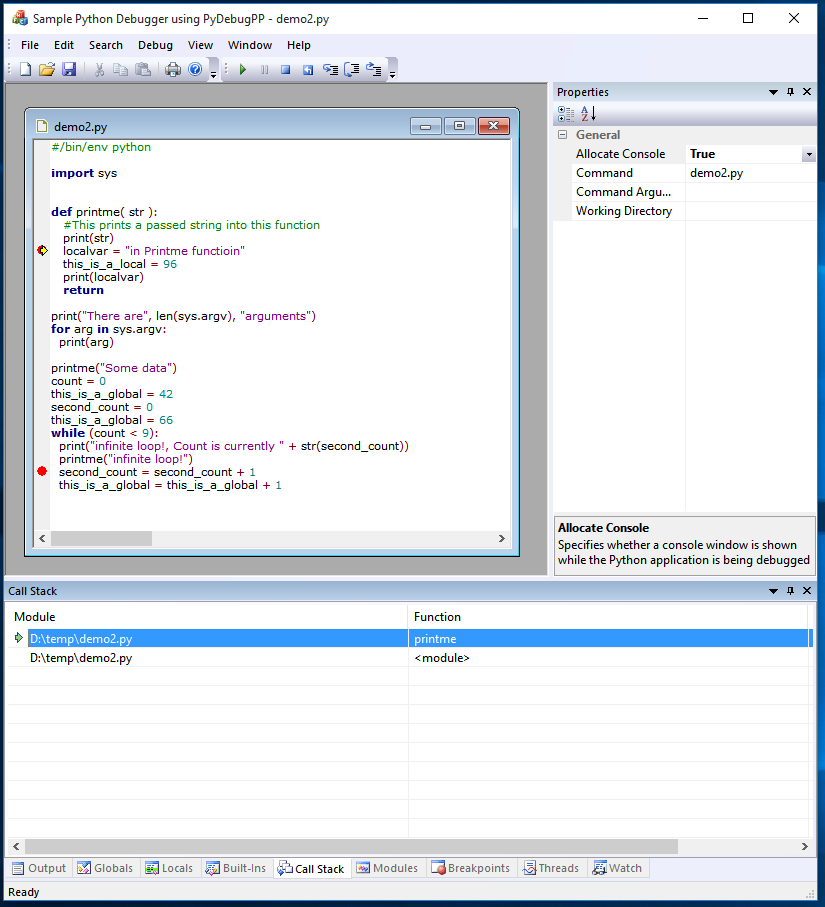
Note how the current stack frame is indicated with an arrow in the Call Stack window. Also double clicking on a stack frame will navigate to the line number in the specified module.
Figure 6: Here's the Modules Window:
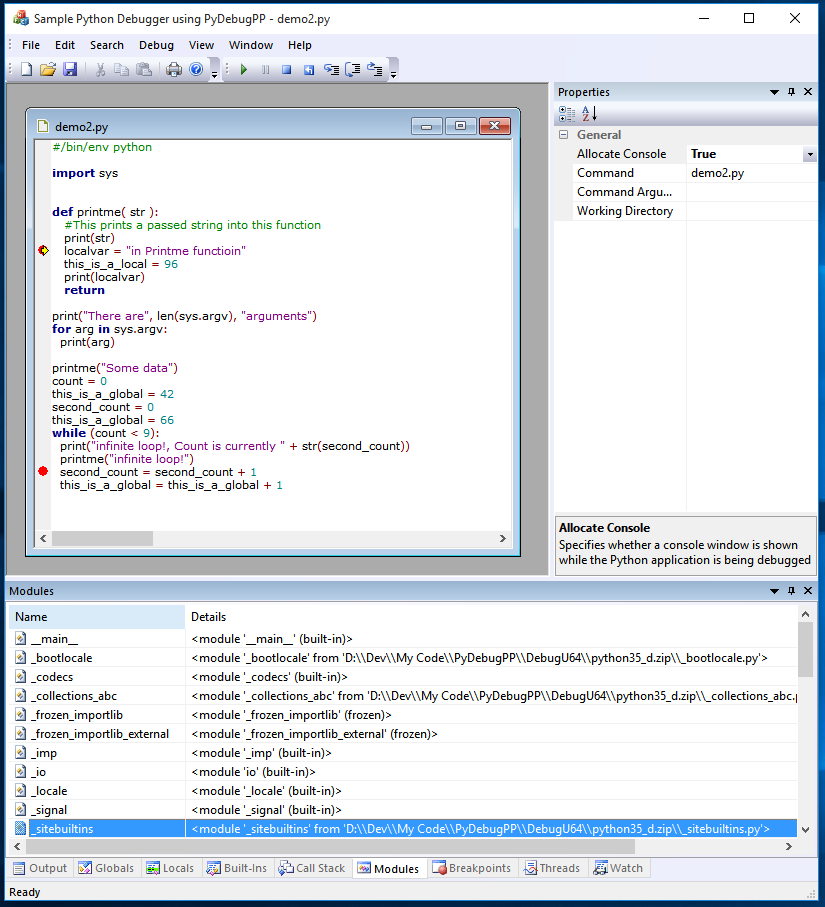
Figure 7: Here's the Breakpoints Window:
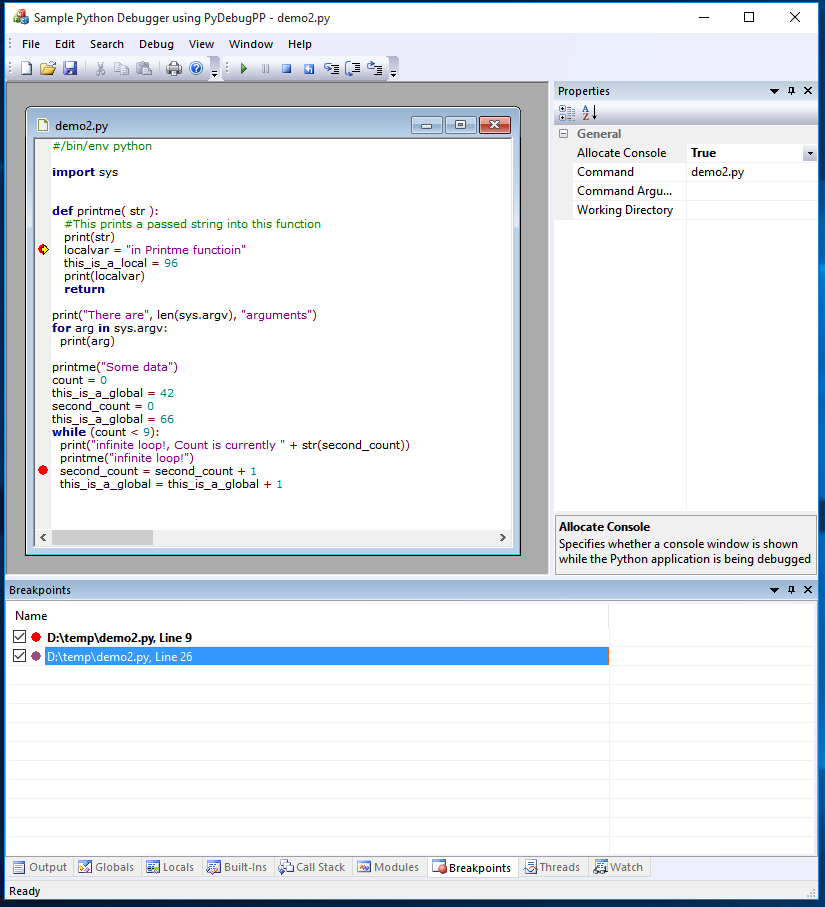
Note how the breakpoint which the instruction pointer has stopped at is highlighted in bold to indicate it is the active breakpoint. This is implemented using Custom Draw code in the List View class used by the Breakpoints window. Also double clicking on a breakpoint in the Breakpoints window will navigate to the line number in the specified module. You can also enable / disable breakpoints by checking / unchecking the checkbox. When a breakpoint is disabled it will show as a hollow circle in the document margin UI.
Figure 8: Here's the Threads Window:
I was unable to get the thread information via Python C-APIs so the code uses standard Win32 ToolHelp code to enumerate the threads. Note how the thread which the instruction pointer has stopped at is highlighted in bold and an arrow to indicate it is the active thread being debugged.
Figure 9: Here's the Watch Window:
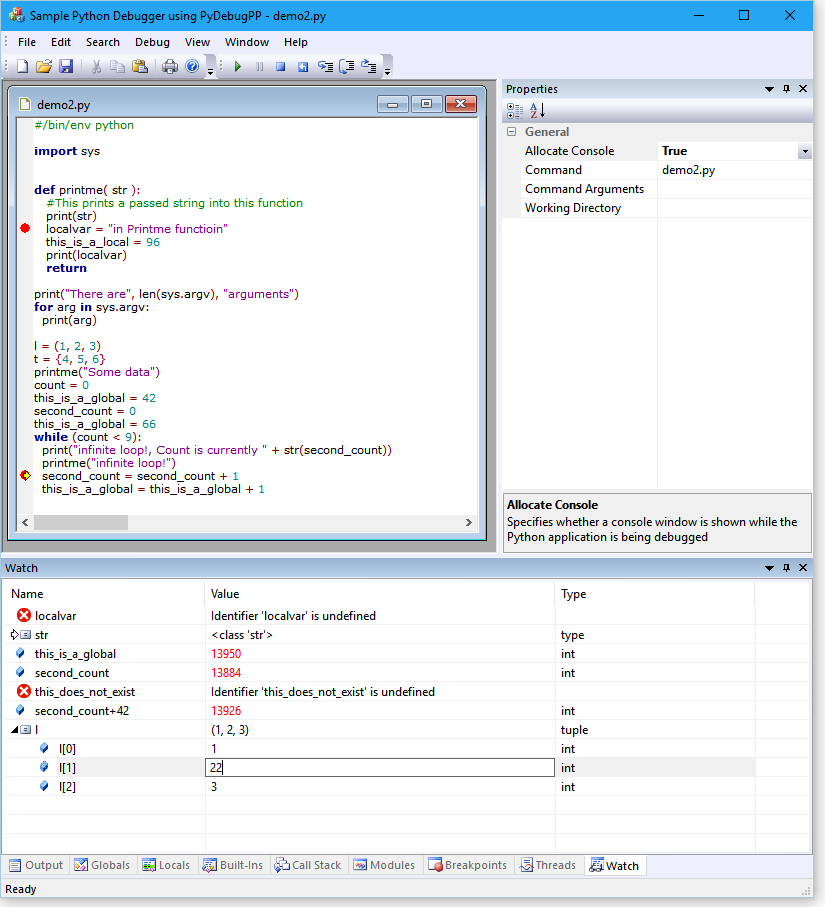
Notice how variables which do not exist in the current scope are identified with a "Stop" icon and explanatory text in the Value column. Also the Python type of the variable is shown in the final "Type" column. As you start typing in the Watch window, you are automatically put in edit mode in the first column to specify the variable name. You can also click into the second column of a variable to allow the value of a variable to be changed. This is achieved using a custom edit control on top of the basic CListCtrl class which the Watch window is based on. One final thing to mention is that after each execution and break cycle of the code any variables which have been changed are shown in red. This is implemented using List View Custom Draw code in the watch window.
Figure 10: Find functionality in the main editor window:
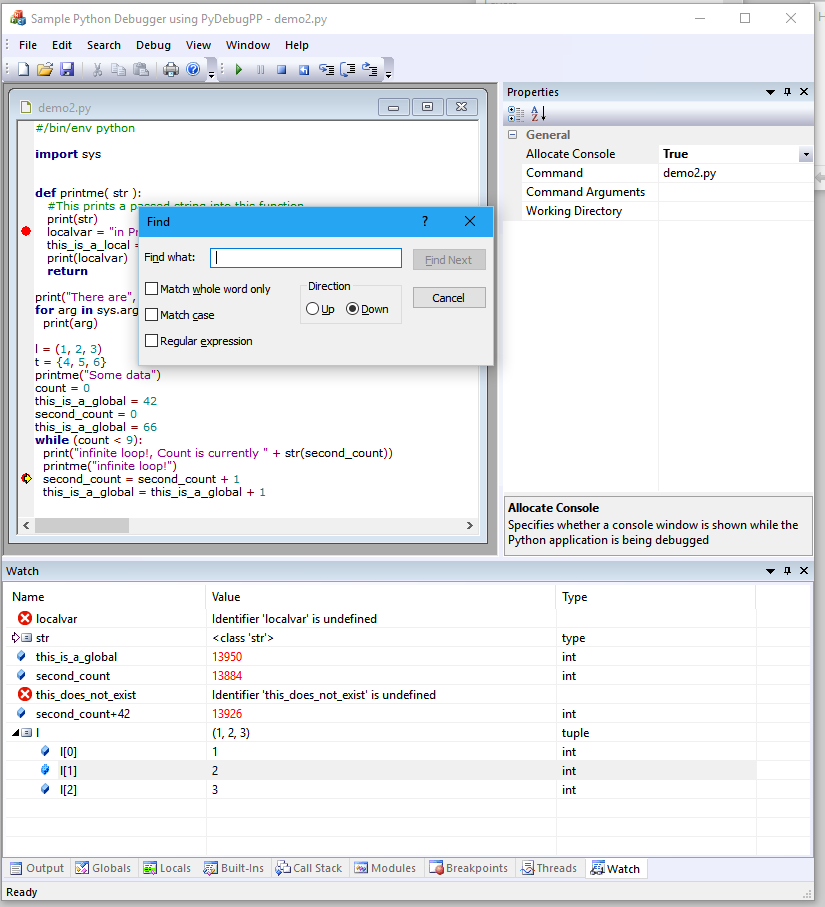
The main document window of PyDebug++ is implemented using the author's Scintilla wrapper classes. As such it picks up all the standard MFC Doc/View support provided for in those classes such as document serialization, Printing, Print Preview and Find functionality. Also the document class is specially setup to implement standard color coding syntax highlighting for your Python source code.
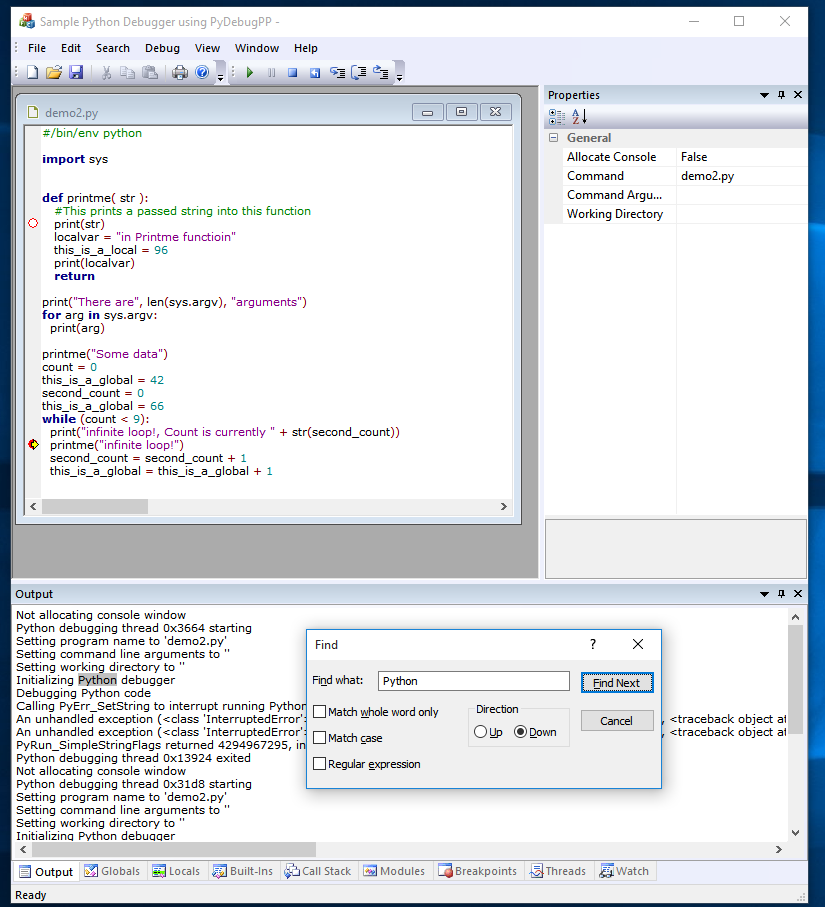
Figure 11: And finally find functionality in the output window:
v1.23 (21 December 2025)
v1.22 (24 January 2023)
v1.21 (17 December 2022)
v1.20 (5 August 2022)
v1.19 (31 December 2021)
v1.18 (8 June 2021)
v1.17 (17 May 2020)
v1.16 (17 May 2020)
v1.15 (12 February 2020)
v1.14 (28 December 2019)
v1.13 (9 November 2019)
v1.12 (11 September 2019)
v1.11 (19 April 2019)
v1.10 (18 November 2018)
v1.09 (11 November 2017)
v1.08 (5 November 2017)
v1.07 (4 April 2017)
v1.06 (28 August 2016)
v1.05 (27 August 2016)
v1.04 (25 July 2016)
v1.03 (24 July 2016)
v1.02 (19 December 2015)
v1.01 (22 August 2015)
v1.0 (20 August 2015)